It’s a really long pause between this post and previous one, but I hope to get pace and write more frequently.
This time we will review new Azure Machine Learning service that was announced recently and will solve that “boring” linear regression task (from my previous posts) using the ML service.
First of all it’s really cool that anyone, who is not familiar with machine learning internals and has only tenuous understanding of how it works, can upload data and classify/estimate/make predictions. But on the other hand, I can’t say, that Azure ML is a silver bullet, at least it was easier to me to code solution in Python than use Azure.
I assume that you familiar with Azure and have trial or paid account there. If not, it worth creating it and playing a little. It’s free for 30 days. Anyway let’s get started.
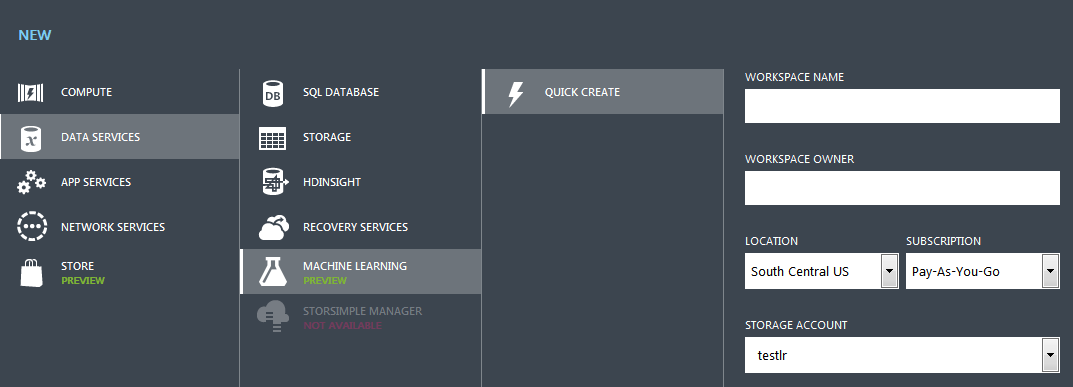
First of all we need to create Machine Learning workspace. After filling all required fields, new ML workspace is created and you can start you analysis. It appears at your Azure dashboard, just click on it, and then click Go To ML Studio link.
To start analysis, we have to create dataset first. Certainly, sample dataset can be used, and Azure provides them for tests and experiments. But since we are in context of our previous posts on ML topic, let’s use our old dataset. You can download dataset here, if you want to repeat my post step by step.
Choose any name for the dataset and specify CSV file with header in the Dataset type field.
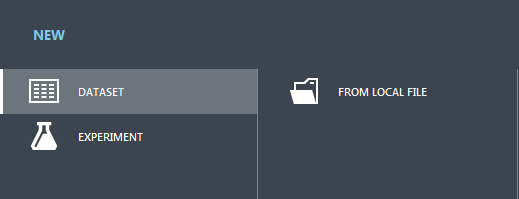
Now it’s time to create Experiment. On the bottom panel choose Add new->Experiment which is kind of intuitive step.
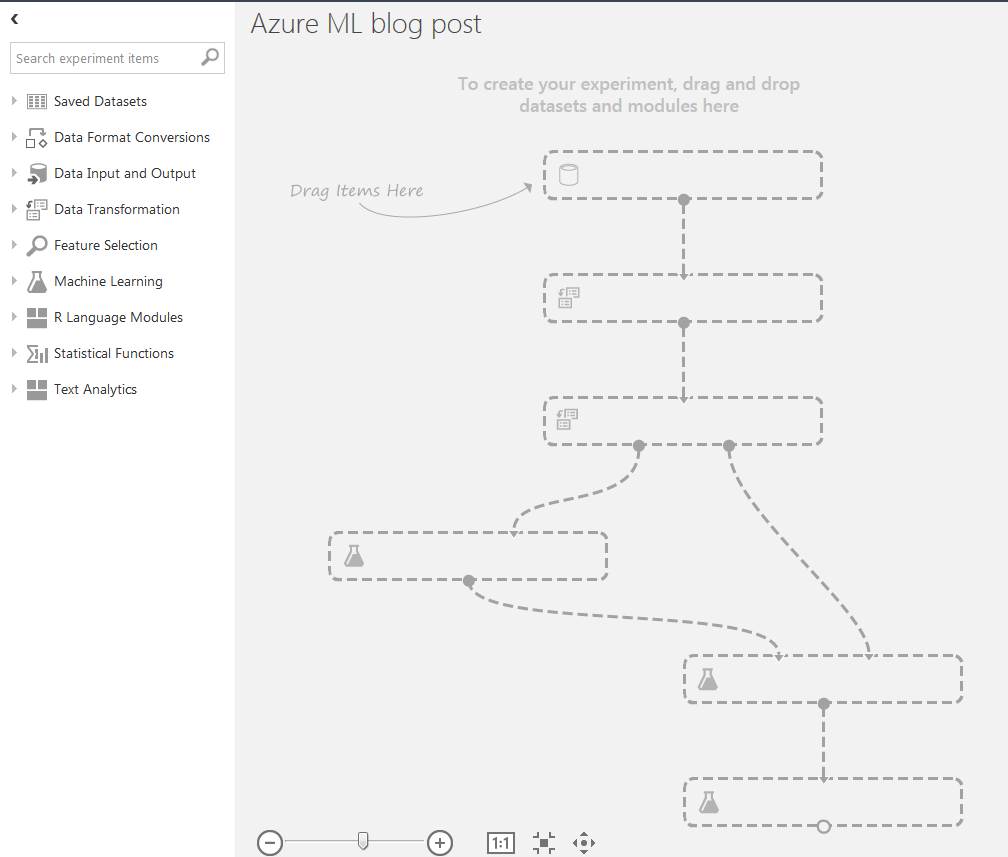
New window looking as at the picture below will be opened and you can finally start modeling process.
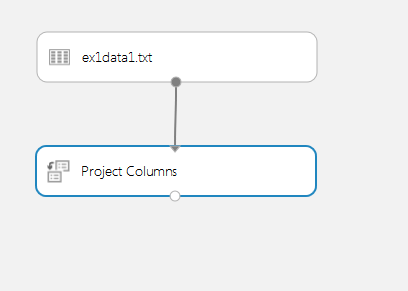
First of all we need our dataset to be used. Expand Saved Datasets, find it there and drag to the experiment window. Then we need to choose columns we want operate with, i.e. our feature columns and label column. Drag item Data Transformations -> Manipulation -> Project Columns to the experiment window, click it and at the right side of the ML studio in the task properties click Launch column selector. Since we have only two columns in our dataset we won’t spend too much time in the settings window. Choose Begin With -> All columns and remove any error rows that are below this label. Now your experiment window should look like below
Now we have to choose which column we’re trying to predict, i.e. label column. To do it, drag Data Transformation -> Manipulation -> Metadata Editor.
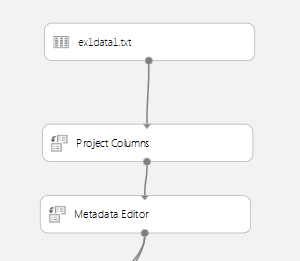
In the properties of the Metadata Editor task at the right side (OK, this is the last mention of the “right side”. All properties are displayed there, so I won’t say it again and again) of your experiment launch column selector and choose following configuration there.
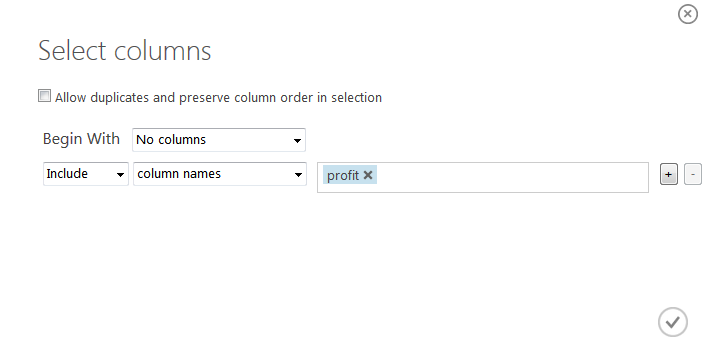
as I told we need to choose which column is label, i.e. which one is the outcome of our experiment. All other columns act as input values.
As we’re estimating profit of the city based on its population, it’s clear that profit column is our label.
Close the window and go to the properties window again and configure following values there
- Data Type - Double
- Categorical - NonCategorical
- Fields - Labels
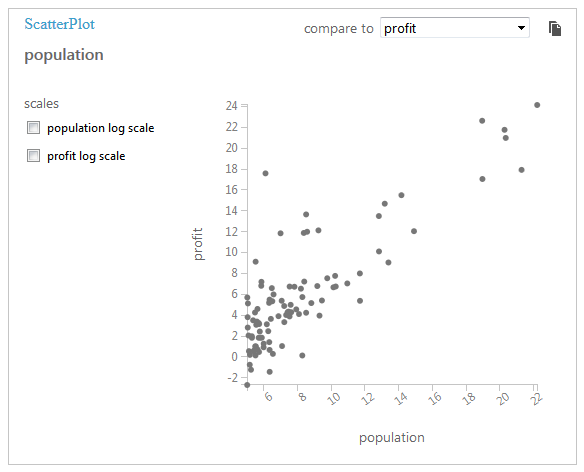
By the way, you can play a little with the added data and visualize them to view relationship between features and labels.
To do it, point mouse to the output port of the Dataset task, click it and in the drop-down menu choose visualize.
You can click columns to add them to the plot and in the top of the view, if compare to is filled in, relation between columns
is displayed.
So now we have everything to train our model and estimate profit value of the any city population.
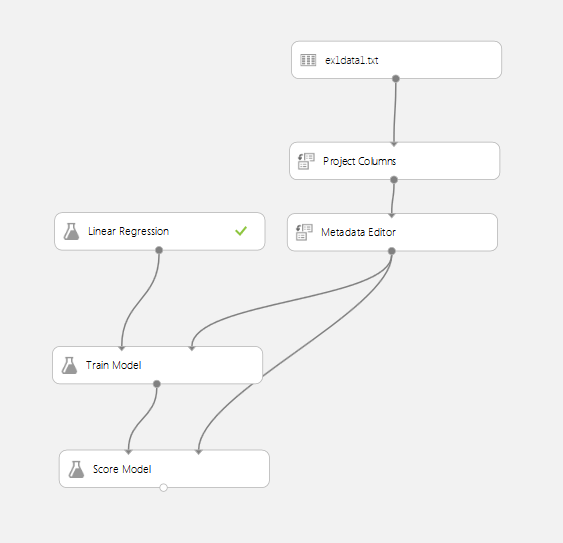
Drop following items to the experiment: Machine Learning -> Initialize Model -> Regression -> Linear Regression and Train -> Train model.
Then connect output port of the Metadata Editor to the right or dataset port of the Train Model item and left or
untrained model port of the Train Model task to the one and only port of the Linear Regression task. After it’s done,
you will have trained model and ready to estimate new values of the profit by the city population.
Drag Machine Learning -> Score -> Score Model to the experiment and connect its dataset port to the Metadata Editor
and trained model to the task Train Model. If you did everything right, experiment would look like this
It’s time to run it and check our results.
Press Run button and after experiment is executed, click scored model port of the Score Model dataset to open results
window. Unfortunately linear function coefficients are not reported by the ML tool, but you can build scatter plots to see
original labels and estimated ones.
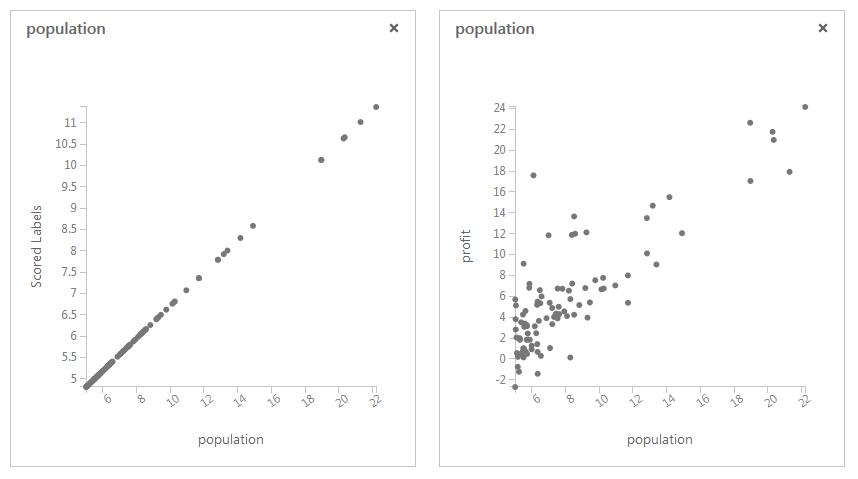
At the end of your experiment you should have estimates like at the picture above.
And that’s it.